Protein Vending Machine Unit Economics: How to Calculate Revenue, Costs and Break-Even
Machine price and headline revenue tell you almost nothing. Here is how to model one machine at one location: revenue, product cost, contribution, fixed costs, break-even and payback, with a calculator to run your own numbers.

On this page25 sections
- What Is Unit Economics for a Protein Vending Machine?
- The Basic Unit Economics Formula
- Step 1: Calculate Daily Revenue
- Step 2: Calculate Product Cost
- Step 3: Understand Gross Margin
- Step 4: Account for Variable Costs
- Step 5: Calculate Contribution Margin
- Step 6: Include Fixed Monthly Costs
- Step 7: Calculate Break-Even Transactions
- Step 8: Calculate the Initial Investment and Payback
- A Worked Protein Vending Machine Unit Economics Example
- Calculator
- The Most Important Variable: Transactions Per Day
- How Gym Footfall Affects Unit Economics
- What Happens If the Average Selling Price Changes?
- Revenue Is Not the Same as Profit
- What a Protein Vending Machine Business Model Should Include
- How to Calculate Break-Even Revenue
- How to Calculate Payback Period
- Build Three Scenarios Before Investing
- Why Location Matters More Than the Machine
- How FuelBot Fits the Unit Economics Model
- A Practical Unit Economics Checklist for Gym Owners
- Final Thoughts
- Frequently asked questions
Buying a protein vending machine is not simply a question of how much the machine costs. For a gym owner the more important question is whether each sale contributes enough to justify the investment and the running costs.
That is what protein vending machine unit economics answers. Unit economics looks at the financial performance of a single unit of the business. Here the unit is one machine, at one gym, over one operating period.
Instead of leaning on broad claims about vending profitability, you can build your own model from a handful of variables: daily transactions, average selling price, product cost, gross margin, payment costs, maintenance, electricity, replenishment, any revenue share with the venue, and the machine investment. The result is a practical answer to whether a machine makes sense for your location.
What Is Unit Economics for a Protein Vending Machine?
Unit economics measures the revenue and costs attached to one business unit. For a protein vending machine that unit is:
The model exists to answer five questions:
- How much revenue can one machine generate?
- How much does each transaction contribute?
- What are the recurring operating costs?
- How many sales are needed to break even?
- How long could it take to recover the initial investment?
A machine doing ₹1,00,000 a month in sales sounds impressive until you subtract what the products cost, what it costs to run, and what you paid for it.
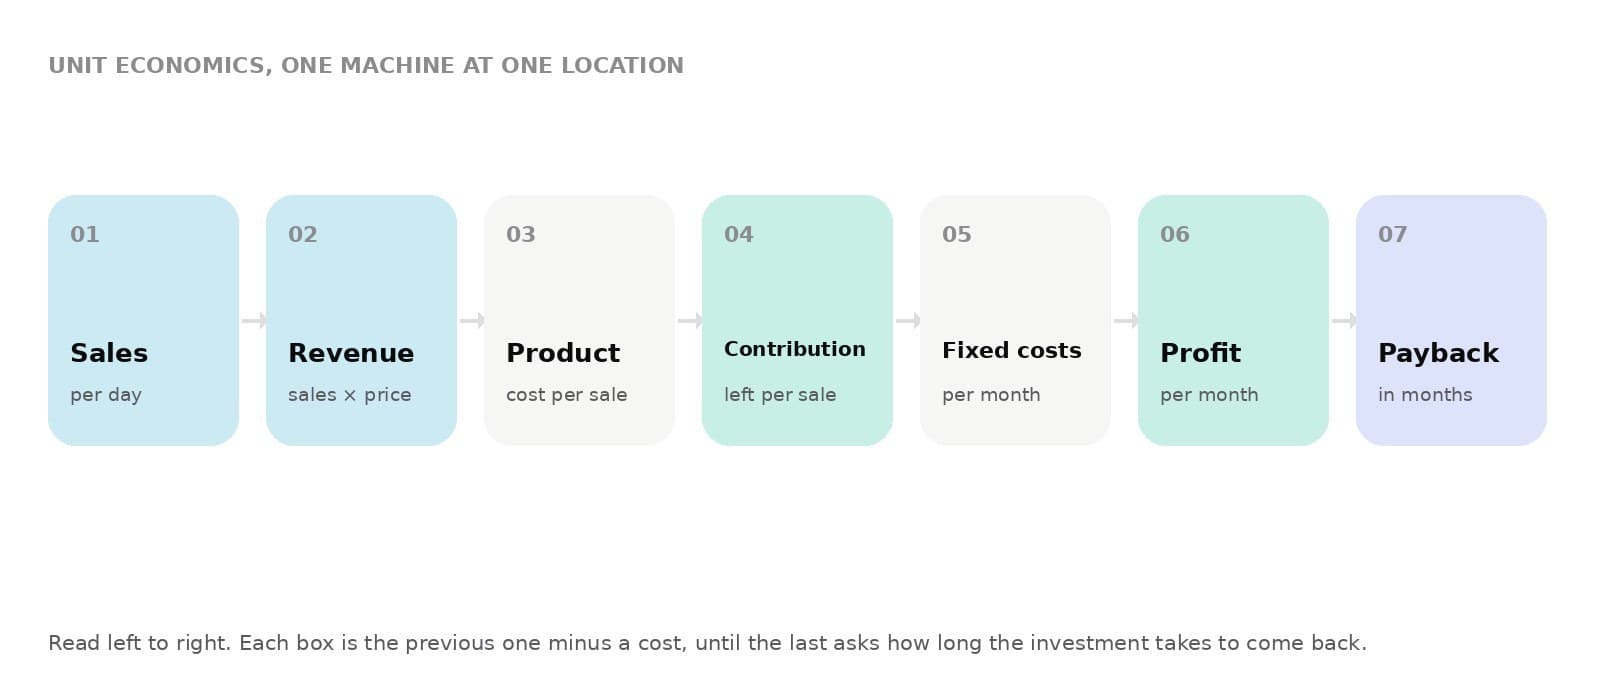
The Basic Unit Economics Formula
A simple model starts with five numbers and two subtractions.
The exact calculation depends on the machine, the product mix, the location and the commercial arrangement with the venue. The structure does not change.
Step 1: Calculate Daily Revenue
The first estimate is daily transaction volume. Suppose a gym expects 25 transactions a day and the average customer spends ₹150.
This is gross sales, not profit. That distinction is the whole point of the article.
Step 2: Calculate Product Cost
Every product sold has a cost. Suppose the average product cost is ₹70 per transaction.
The real margin varies a lot with the products you stock and what you pay for them.
Step 3: Understand Gross Margin
Gross margin is what remains of revenue after the direct cost of the products sold.
A higher gross margin leaves more to cover operating expenses and recover the machine. It is still not net profit.
Step 4: Account for Variable Costs
Some costs rise with every transaction: payment processing charges, packaging, consumables, wastage where it applies, and other per-sale service costs. If they average ₹5 per transaction:
Step 5: Calculate Contribution Margin
Contribution is what each sale leaves towards fixed costs and, eventually, profit.
Step 6: Include Fixed Monthly Costs
Other costs do not move with each sale: maintenance, software or connectivity fees, electricity, cleaning, insurance, location fees or revenue share, servicing and admin. Suppose they total ₹15,000 a month.
That is the machine's approximate operating break-even volume under these assumptions.
Step 7: Calculate Break-Even Transactions
Seven sales a day is a number a gym owner can test against real footfall. "High revenue" is not.
Step 8: Calculate the Initial Investment and Payback
Operating break-even is not investment payback. The initial outlay can include the machine, installation, configuration, transport, opening stock, branding and other setup costs. Suppose it totals ₹6,00,000 and the machine produces ₹30,000 a month in operating profit before financing and tax.
Actual payback differs because sales move over time and there are financing costs, taxes, maintenance events and other expenses the simple version ignores.
A Worked Protein Vending Machine Unit Economics Example
| Metric | Example |
|---|---|
| Daily transactions | 25 |
| Average selling price | ₹150 |
| Daily revenue | ₹3,750 |
| Monthly revenue | ₹1,12,500 |
| Average product cost | ₹70 |
| Variable cost per transaction | ₹5 |
| Contribution per transaction | ₹75 |
| Monthly contribution | ₹56,250 |
| Fixed monthly costs | ₹15,000 |
| Estimated monthly operating profit | ₹41,250 |
These figures are illustrative only. Results depend on pricing, product costs, transaction volume, location costs, maintenance and the rest of the operating picture. They are not Griffinmark's revenue, margin or return figures.
Protein vending machine unit economics calculator
Replace the example assumptions with your gym’s footfall, pricing and costs. Everything recalculates as you type. Nothing is sent anywhere.
Illustrative arithmetic on your own assumptions. It is not a forecast, and it is not a Griffinmark revenue, margin or return figure.
The Most Important Variable: Transactions Per Day
Machine capacity is a small part of the equation. Customer demand is the big one. The same machine in a gym with 1,500 members and one with 200 members will not produce the same numbers.
| Scenario | Transactions / day | Average sale | Monthly revenue |
|---|---|---|---|
| Low | 10 | ₹150 | ₹45,000 |
| Moderate | 25 | ₹150 | ₹1,12,500 |
| High | 50 | ₹150 | ₹2,25,000 |
Same machine, different economics, because transaction volume changes the whole model. Evaluate location and demand before you evaluate hardware.
How Gym Footfall Affects Unit Economics
Not every member buys. What matters is the share who do. A gym with 1,000 active members where 2% buy on a given day produces 20 transactions, or ₹3,000 a day at ₹150. The purchase rate is a variable in its own right, so refine it with member count, daily footfall, peak-hour traffic, existing supplement sales, demographics and average spend. Better inputs make a more useful model.
What Happens If the Average Selling Price Changes?
At 25 transactions a day, monthly revenue is ₹75,000 at a ₹100 average, ₹1,12,500 at ₹150 and ₹1,50,000 at ₹200. That is why product mix and pricing matter. Raising prices does not automatically raise profit, though. If higher prices cut purchase frequency enough, total contribution falls. The target is a sustainable combination of price, demand and margin.
Revenue Is Not the Same as Profit
The most common mistake in vending economics is stopping at revenue. ₹1,50,000 in monthly sales sounds attractive until the business spends ₹75,000 on products, ₹10,000 on operating expenses, ₹15,000 on location or revenue share and ₹5,000 on other costs. Read the model as a chain:
What a Protein Vending Machine Business Model Should Include
Revenue
- Transactions per day
- Average selling price
- Operating days per month
- Product mix
Direct costs
- Product cost
- Packaging and consumables
- Transaction fees
Operating costs
- Electricity, maintenance and cleaning
- Connectivity or software
- Replenishment
- Location fees or revenue share
Investment
- Machine cost and installation
- Initial inventory
- Branding or customisation and other setup costs
Financial outputs
- Gross margin and contribution margin
- Monthly operating profit
- Break-even transactions and break-even revenue
- Payback period
How to Calculate Break-Even Revenue
Sometimes revenue is easier to think in than transactions.
Illustrative again, not a prediction of how any FuelBot will perform.
How to Calculate Payback Period
Shorter is better, but do not judge payback alone. Weigh machine lifespan, maintenance, demand stability, location quality, product margins, financing costs, growth and eventual replacement.
Build Three Scenarios Before Investing
One optimistic projection is a guess. Three scenarios show how sensitive the investment is to demand.
| Metric | Conservative | Expected | Upside |
|---|---|---|---|
| Daily transactions | 10 | 25 | 50 |
| Average sale | ₹140 | ₹150 | ₹160 |
| Monthly revenue | ₹42,000 | ₹1,12,500 | ₹2,40,000 |
Why Location Matters More Than the Machine
Always calculate unit economics at the location level. A good machine cannot carry weak demand indefinitely. Check daily footfall, visibility, accessibility, member demographics, existing supplement purchases, opening hours, nearby retail and product preferences. A unit by a busy exit and the same unit in a quiet corner are two different businesses.

How FuelBot Fits the Unit Economics Model
Griffinmark Robotics' FuelBot range is built for automated protein and supplement vending in fitness and commercial venues. When you evaluate a FuelBot deployment, build the same location-specific model: expected transactions a day × average transaction value = estimated daily sales, then apply product costs and operating expenses to reach contribution and operating profit.
The point to hold on to: FuelBot does not set the economics of a location. Demand, pricing, margins, operating costs and utilisation do. The machine's job is to capture the demand that is there, reliably and without staff.
A Practical Unit Economics Checklist for Gym Owners
Demand
- How many members use the gym every day, and how many at peak?
- How many already buy protein or sports nutrition?
Pricing
- What is the expected average transaction value?
- What will be sold, and at what margin?
Operations
- Who restocks, how often, and what will servicing cost?
Location
- Where will it stand, how visible is it, and can members reach it easily?
Financials
- Initial investment and monthly fixed costs
- Contribution per transaction
- Transactions needed to break even
- Expected payback period
Final Thoughts
Do not judge a protein vending machine by its price or its headline revenue. Ask how much each transaction contributes, and how many transactions it needs to cover its costs and recover the investment. Work the chain: revenue → product cost → contribution → operating costs → break-even → payback.
There is no universal return figure for every gym. The reliable approach is your own footfall, your expected purchase rate, your product margins and your operating costs, modelled for your location. If you are exploring automated supplement retail, the FuelBot range is the platform to run that model against, and the team at Griffinmark Robotics will run it with you.